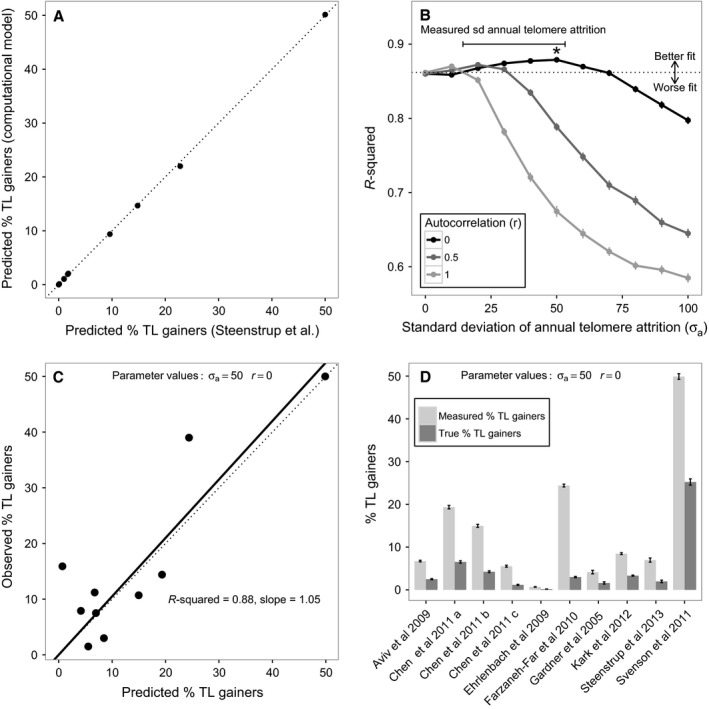
Figure 4.

Simulated scenarios with true TL lengthening provide the best fit to empirical data on the observed percentage of TL gainers. Panels explore how well our computational model predicts the empirical data from the same 10 studies analysed by Steenstrup et al. (2013a; see Table S1, Supporting information). (A) Correlation between predicted percentage of TL gainers derived from Steenstrup et al.'s analytical approach and from our computational model with no true TL gainers (i.e. σa = 0 and r = 0). The dotted line shows the expectation if the correlation is perfect. Results are based on assuming n = 10 000 individuals per study in the simulation. (B) The fit between the empirically observed percentage of TL gainers and the percentage of TL gainers predicted by the computational model for a range of different parameter value combinations. Results are based on simulations assuming the actual numbers of individuals in the empirical studies being modelled (n = 50–635) and the reported number of interassay replicates of TL measurement (1 or 2; see Table S1, Supporting information for details). The points show the mean r‐squared values derived from 100 replicates of the simulation, and the error bars show the 95% confidence intervals for these means. The dotted line shows the fit of Steenstrup et al.'s model; points above this line correspond to parameter combinations in the computational model that predict the observed data better than the latter scenario, and points below this line correspond to parameter combinations that predict the observed data worse. The best‐fitting parameter combination (σa = 50 and r = 0) is indicated with an asterisk (*). The range of values of the standard deviation of annual telomere attrition reported in papers from the Steenstrup et al.'s data set is shown with a bar; these comprise 14.3–14.9 (Kark et al., 2012), 29.4–53.2 (Chen et al., 2011), 27.4 (Steenstrup et al., 2013b) and 46.0 bp year−1 (Aviv et al., 2009). (C) Fig 1B replotted using the predictions derived from the best‐fitting parameter combination in the computational model in place of Steenstrup et al.'s predictions. (D) The predicted measured percentage of TL gainers and the predicted true percentage of TL gainers derived for each of the studies in the Steenstrup et al.'s data set using the best‐fitting parameter combination in the computational model. Bars show the mean ± 95% confidence intervals from 100 replicates of the simulation.
