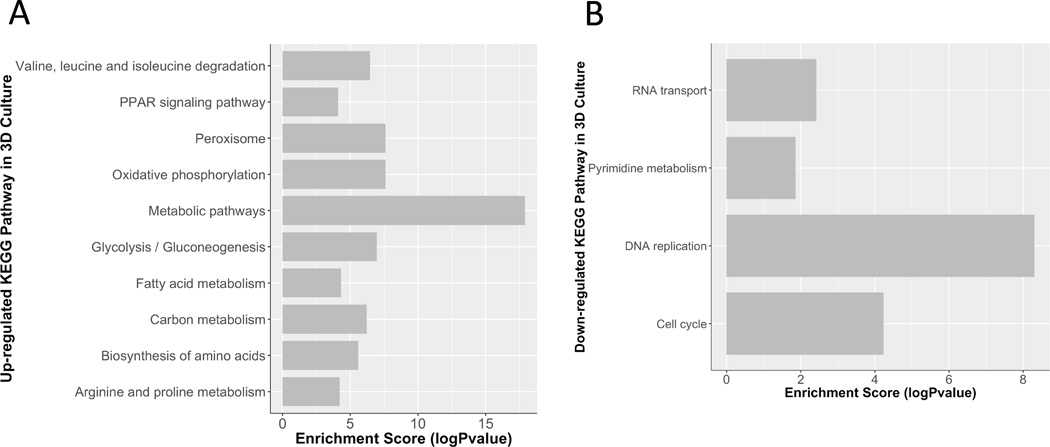
Figure 6. KEGG Pathway Analysis.
The up and down regulated proteins in the proteomic dataset were analyzed by KEGG Pathway analysis to examine the expression changes in well-annotated pathways. A) The table shows pathways enriched in the up regulated proteins groups in the 3D sample compared to the 2D sample are shown, including their enrichment score. B) The table shows pathways enriched in the down regulated proteins groups in the 3D sample compared to the 2D sample are shown, including their enrichment score. Many of the down regulated pathways in the 3D versus the 2D sample are related to cell growth.

