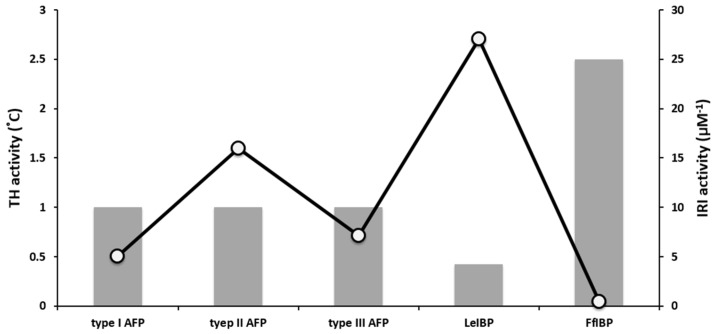
Figure 4.
A graph of TH and IRI activities of marine-derived AFPs. TH values, represented as a bar, are from Figure 2B. The IRI activities (O) are expressed as the reciprocal of endpoint of each AFP. The endpoint indicates the lowest concentration at which the AFP shows IRI activity. Higher IRI value means more effective in IRI. The LeIBP is weaker in TH but higher in IRI activity, but vice versa in FfIBP. This plot demonstrates that the TH values are not proportional to IRI activities.

