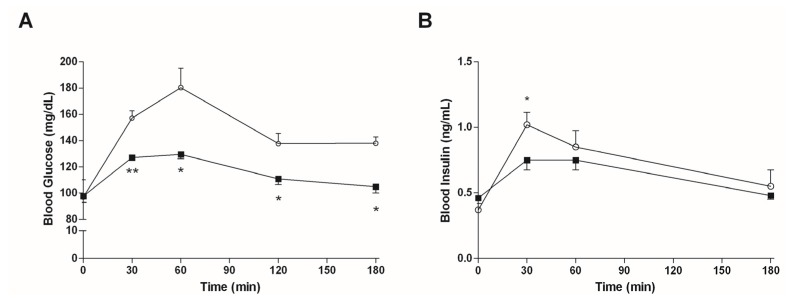
Figure 5.
Postprandial plasma glucose (A) and insulin (B) levels in mice fed with high-fat diet treated with vehicle (○, n = 15) or 7.5 mg/kg bw of algal extract (■, n = 15). Data are presented as mean ± SD. * p < 0.05 and ** p < 0.01 vs. mice treated with vehicle, Student’s t-test for unpaired data.

