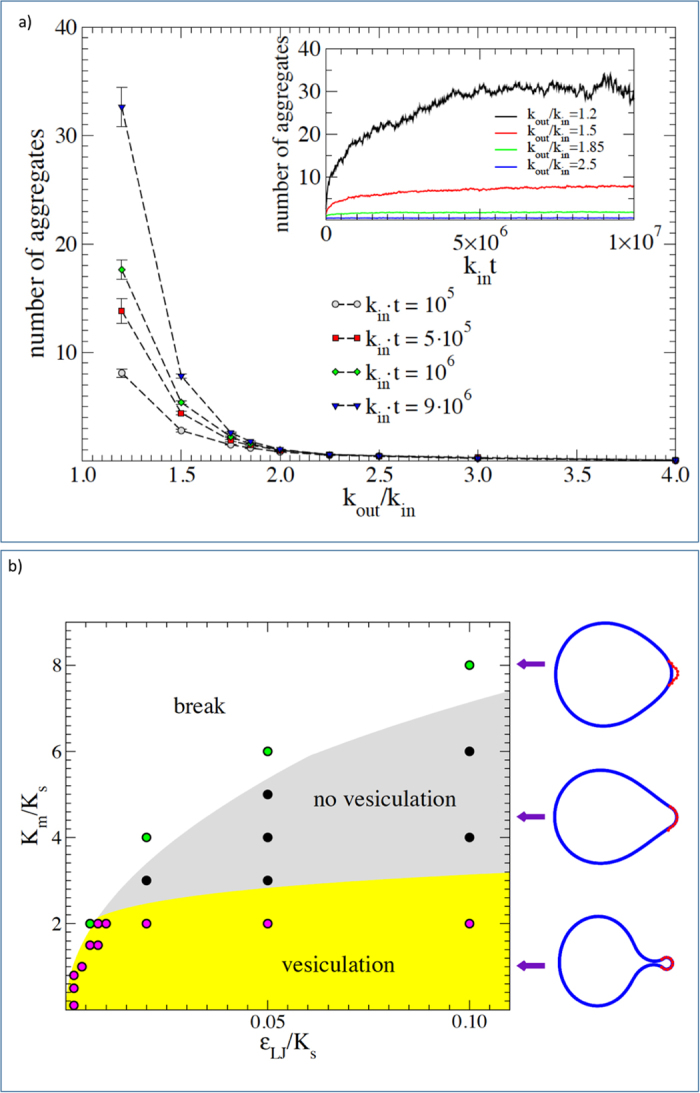
Figure 7. Numerical simulations show protein aggregation induced by impairment of trafficking.

(a) The main figure shows the average number of aggregates observed at a fixed time as a function of kout/kin, the ratio between rate of exit from the ER by means of vesicular transport and the rate of protein production. A reduced value of kout leads to the formation of aggregates. The inset shows the time dependence of the average number of aggregates for different values of kout. (b) The phase diagram of the vesicle formation model. The stiffness ratio between the membrane and the external scaffold Km/Ks as a function of the intensity of the mutual interaction with respect to the scaffold rigidity εLJ/Ks. For soft membranes there is almost always vesicle formation (yellow zone) or the breaking of the coat-membrane interface, if binding is not strong enough (white zone). Increasing the membrane stiffness leads to a new phase appears where the coat-membrane interface is stable but vesicle can not form (grey zone). Typical configurations in the different phases are reported on the right-hand side of the panel.
