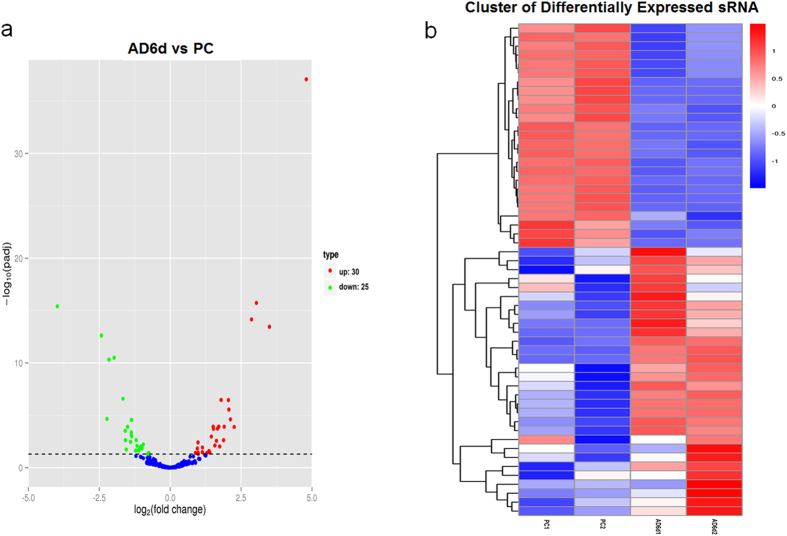
Figure 3. Differentially expressed miRNAs.
(a) Differentially expressed miRNAs in volcano plot. The X-axis stands for the fold change of miRNAs. The Y-axis stands for significant difference of miRNA expression changes. Every miRNA are represented with the dots. The blue dots indicate miRNAs without significant difference; The red dots indicate up-regulated miRNAs; The green dots stand for down-regulated miRNAs. (b) Hierarchical clustering of miRNA expression. miRNA profiles from four libraries were clustered. Samples are in columns, and miRNAs are in rows. Cluster analysis based on log10 (TPM+ 1). The red indicates up-regulated miRNAs, and the blue indicates down-regulated miRNAs.

