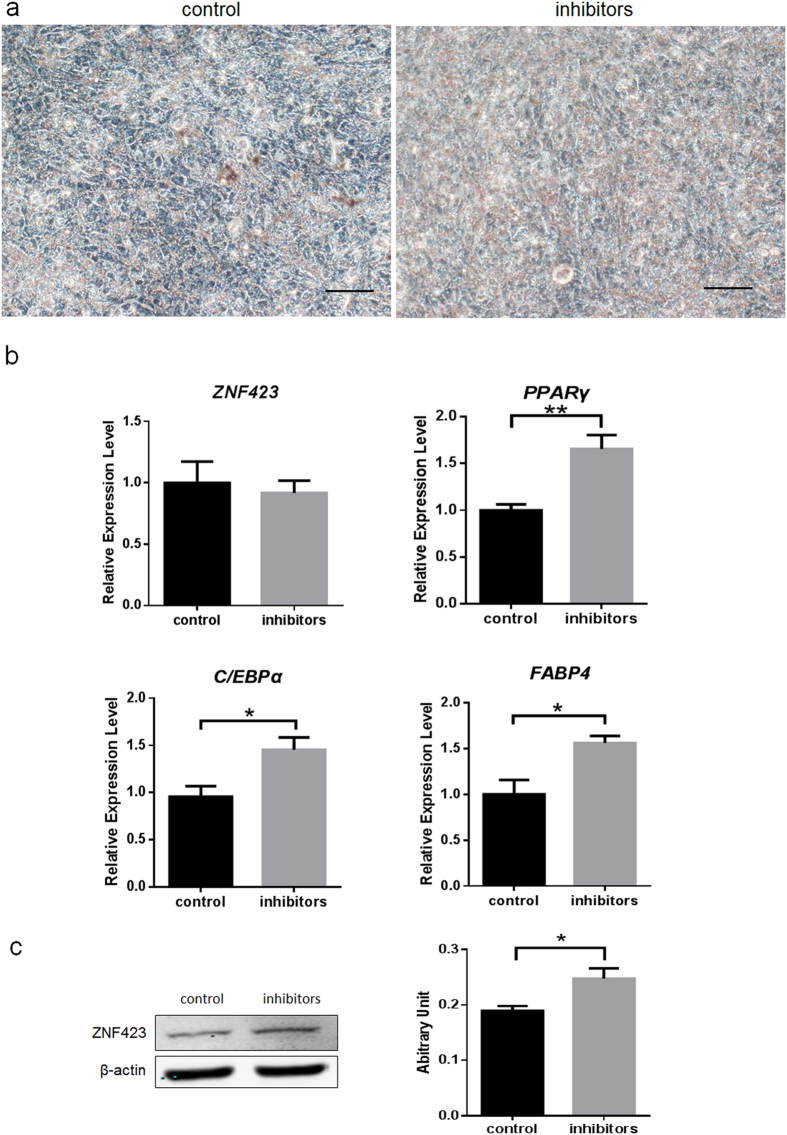
Figure 6. miR-23a inhibits adipogenic differentiation in PDGFRα+ progenitor cells.
(a). Oil Red O staining of PDGFRα+ progenitor cells transfected either control or inhibitors at day 12. Scale bar, 100 μm. (b). mRNA expression of adipogenic markers at day 6. Expression levels were normalized using 18S. Data are presented as the means ± S.E.M. Three independent experiments are conducted in PDGFRα+ progenitor cells. *P < 0.05, **P < 0.01. All the values were expressed relative to the control. (c). Immunoblot analysis of ZNF423 protein at day 12 after transfected miR-23a mimics.

