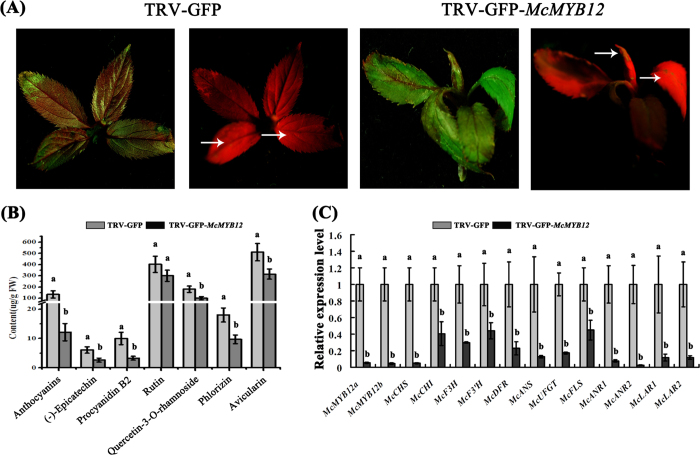
Figure 7. Silencing McMYB12 genes in the ever-red crabapple cultivar ‘Royalty’.
(A) The faded red leaf phenotype was visualized at 14 days post infiltration. (B) flavonoids compound levels in inoculated ‘Royalty’ plantlets in μg/g flesh weight. (C) Relative expression levels in inoculated ‘Royalty’ tissue culture plantlets were determined using qRT-PCR. Error bars indicate the standard error of the mean ± SE of three replicate measurements. Different letters above the bars indicate significantly different values (P < 0.05) calculated using one-way analysis of variance (ANOVA) followed by a Tukey’s multiple range test.

