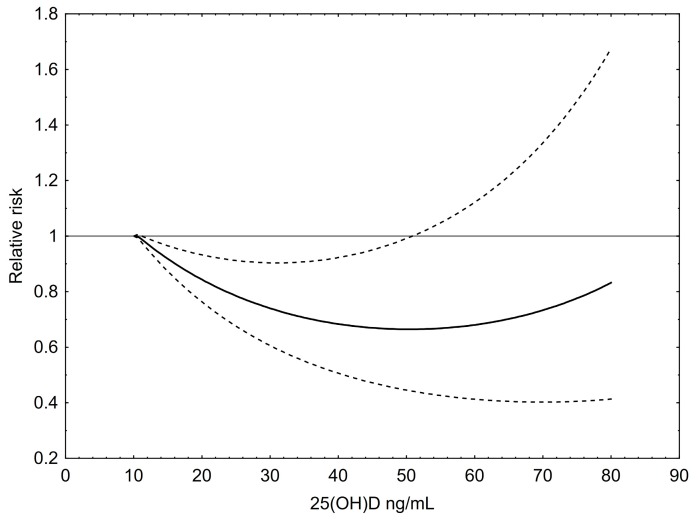
Figure 3.
Dose–response relationship between 25(OH)D concentrations and the relative risk for colorectal cancer. Results of restricted cubic splines analysis of relative risks standardized to a common reference category with 12 ng/mL 25(OH)D as midpoint and inverse variance weights. Dashed lines indicate 95% confidence interval.

