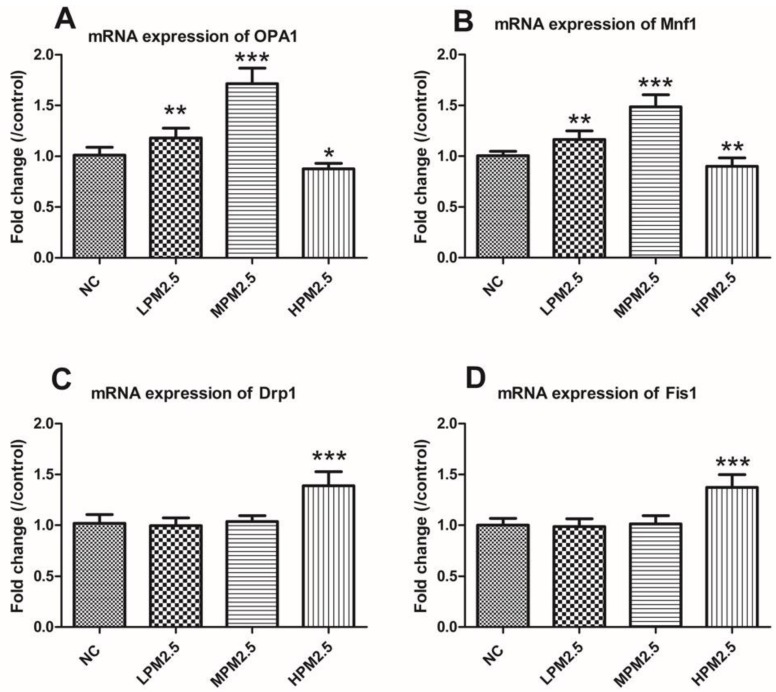
Figure 3.
The effects of PM2.5 on the mRNA expression of OPA1, Mfn1, Drp1, and Fis1 in rat nasal mucosa according to real-time PCR. Values are presented as the means ± SD (n = 8). * p < 0.05, ** p < 0.01, *** p < 0.001 (LPM2.5, MPM2.5, HPM2.5 group vs. NC group). NC = a negative control group, LPM2.5 = exposure to 200 μg/m3 PM2.5 group, MPM2.5 = exposure to 1000 μg/m3 PM2.5 group, HPM2.5 = exposure to 3000 μg/m3 PM2.5 group.

