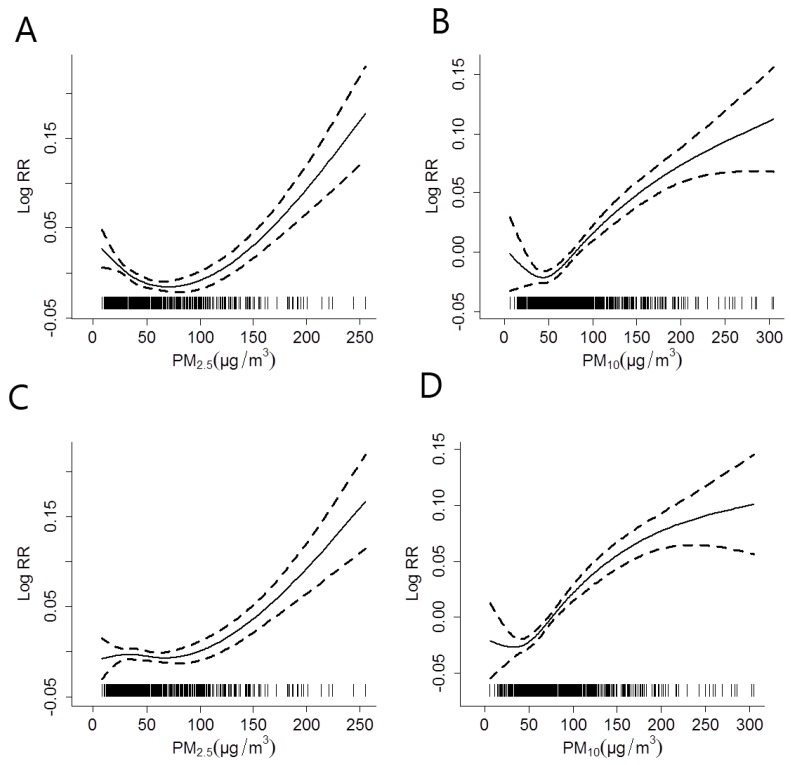
Figure 3.
The concentration-response relationships for PM2.5 and PM10 with IHD hospitalizations at lag 0 across all seasons, after adjusting for the effect of OZONE (C,D) or without adjustment (A,B). The X-axis represents the PM concentrations (µg/m3) on the concurrent day. The Y-axis represents the log-relative risk on the IHD hospitalizations. The solid line indicates the estimated mean change in the log-relative risk, while the dotted lines represent the 95% CI of the estimates.

