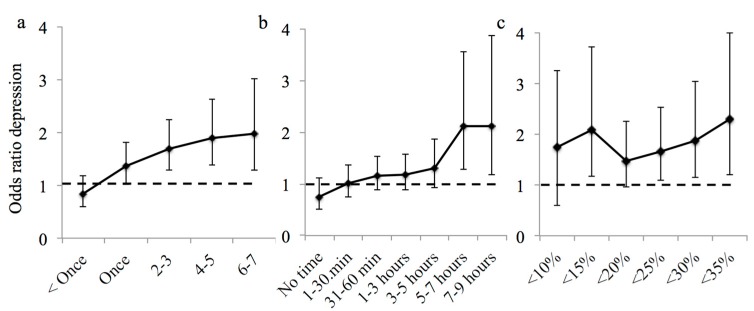
Figure 2.
Dose-response graphs showing the adjusted odds ratio from logistic regression of depression for (a) incrementally increasing frequency of visits of ten minutes or more to a private green space; (b) total duration of time spent in private green space in the past week and (c) percentage neighbourhood vegetation cover. The 95% confidence intervals are shown. An odds ratio above one indicates that an individual is more likely to have depression where the nature dose is not met.

