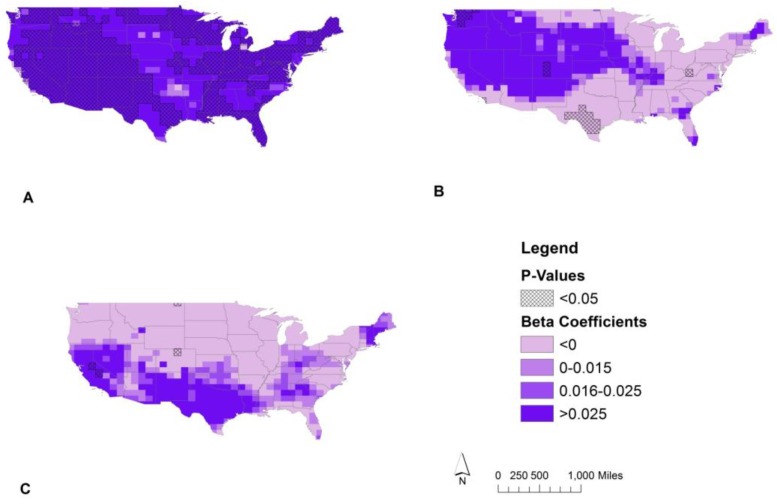
Figure 5.
Trends in erythemal UVB stratified by satellite type. Local linear regression of erythemal UVB by location from 1978 to 2014 at α = 0.05 stratified by satellite. The beta coefficients shown represent the estimated effect of a 5-year increase on the mean erythemal UVB for (A) Nimbus-7 satellite 1978–1993; (B) Earth Probe satellite 1996–2004; and (C) the Ozone Monitoring Instrument 2004–2014. Beta value symbology based on quartiles of the crude analysis with adjustment in quartile 1 for positive value cutoff.

