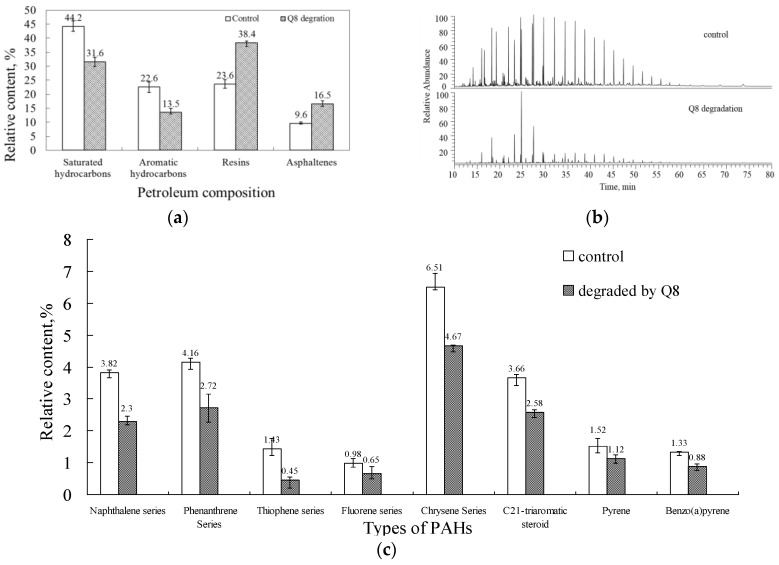
Figure 4.
Differences analysis for items of oil degraded by Q8. The control represented the crude oil in the sterilized same condition. (a) Degradation of fractions of crude oil. Data are expressed as mean value and standard deviation of independent duplicates; (b) Gas chromatograms of total hydrocarbon fractions; (c) Biodegradation of the naphthalene, phenanthrene, thiophene, fluorene, and chrysene series, C21-triaromatic steroid, pyrene, and benzo(a)pyrene during biodegradation by Q8.

