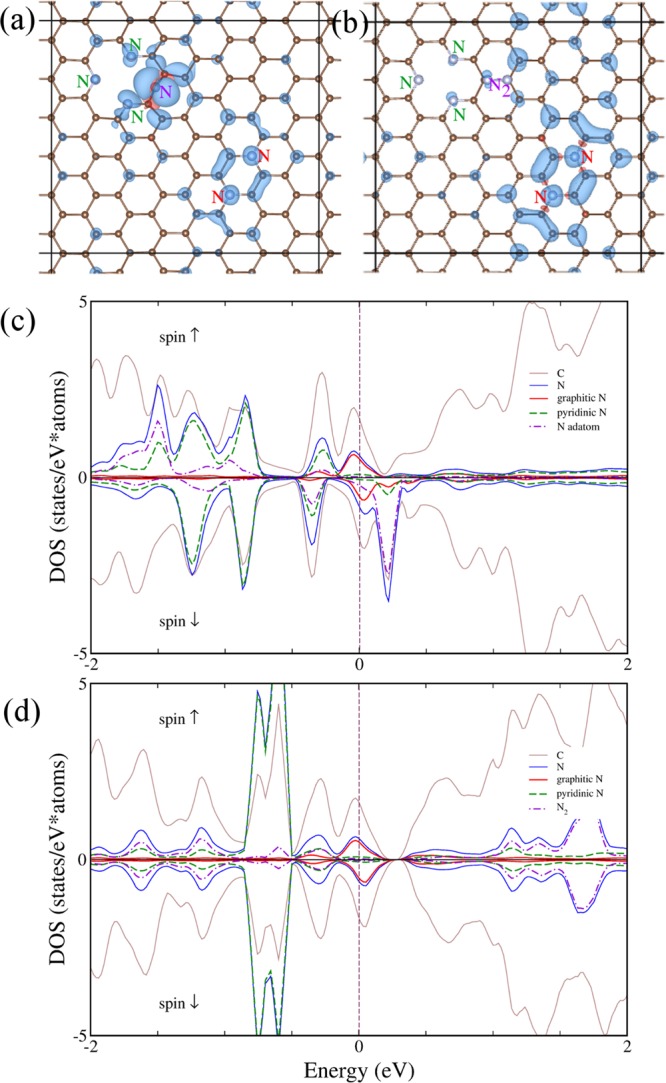
Figure 5.

Top view of graphene doped with graphitic (in para configurations), trimerized pyridinic and chemisorbed (a) N and (b) N2 marked respectively by red, green, and magenta, with positive (negative) spin densities plotted in blue (red) for isosurfaces at ±1 × 10⁻³ (panel (a)) and ±2.5 × 10⁻⁴eÅ–3 (panel (b)). (c, d) The corresponding DOS plot for configuration shown in panel (a) and panel (b), respectively.
