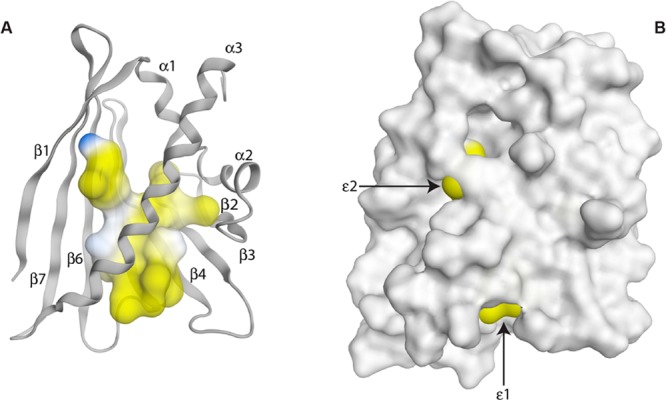
Figure 2.

(A) Internal cavity of Mal d 1.0101, colored according to the lipophilic potential as implemented in MOE,32 where hydrophilic regions are colored in blue and lipophilic regions are colored in yellow. (B) Surface representation of the lowest energy solution structure of Mal d 1.0101. The two amphiphilic entrances to the internal cavity are indicated as ε1 (between the N-terminal end of helix α3 and the loops connecting strands β3−β4 and β5−β6) and ε2 (between the edge of the β-sheet and the C-terminal end of helix α3).
