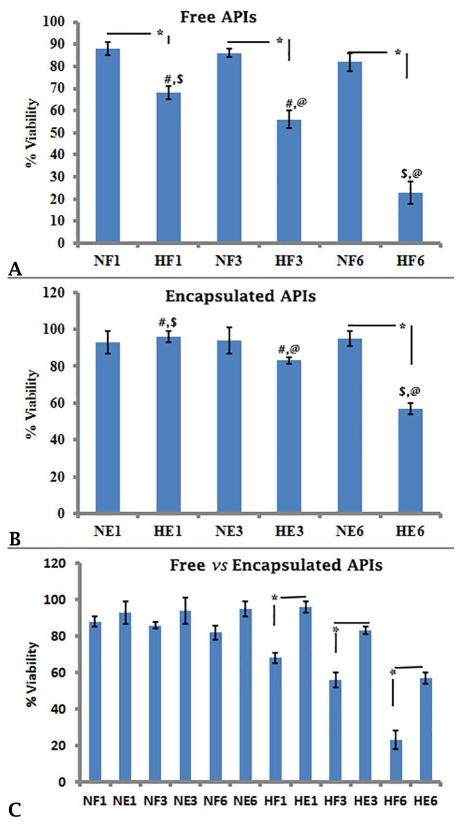
Figure2.
The viability of free and encapsulated APIs under normoxia and hypoxia. Representative results are shown in Figures 2A, 2B and 2C. The viability was calculated by counting number of live (green) and dead (red) cells from confocal micrographs and the results were expressed as average ± standard deviation (SD). Statistically significant differences (*, #, $, @) between groups (n=3 confocal micrographs from each experimental condition) were determined using the unpaired students t test (p≤0.05). NF1, NF3, NF6 = Free APIs under normoxia on Days 1, 3 and 6 of culture; HF1, HF3 and HF6 = Free APIs under hypoxia on Days 1, 3 and 6 of culture; NE1, NE3 and NE6 = Encapsulated APIs under normoxia on Days 1, 3 and 6 of culture; HE1, HE3 and HE6 = Encapsulated APIs under hypoxia on Days 1, 3 and 6 of culture.

