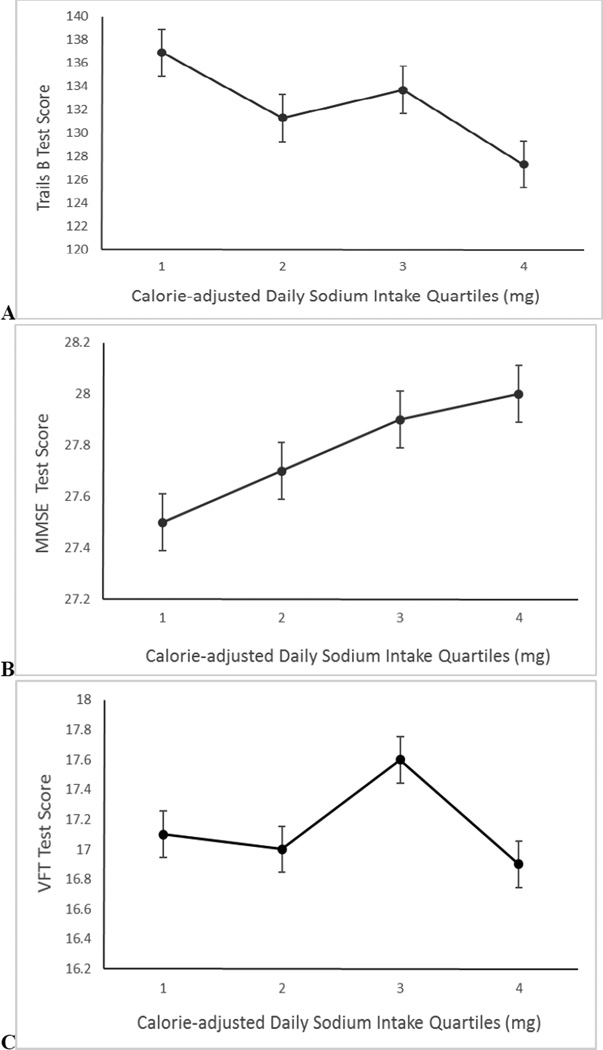
Figure 1.
Mean (SEM) performance on (A) Trail-making Test, part B (Trails B) (p=0.073), (B) Mini-Mental State Examination (MMSE) (p=0.007), and (C) Verbal Fluency Test (VFT) (p=0.897) by quartile of calorie-adjusted daily sodium intake. Mean test scores are adjusted for age, sex, education level and total caloric intake. Note: p-values represent linear test for trend; y-axes show test score; note range does not begin at zero.

