Figure 1.
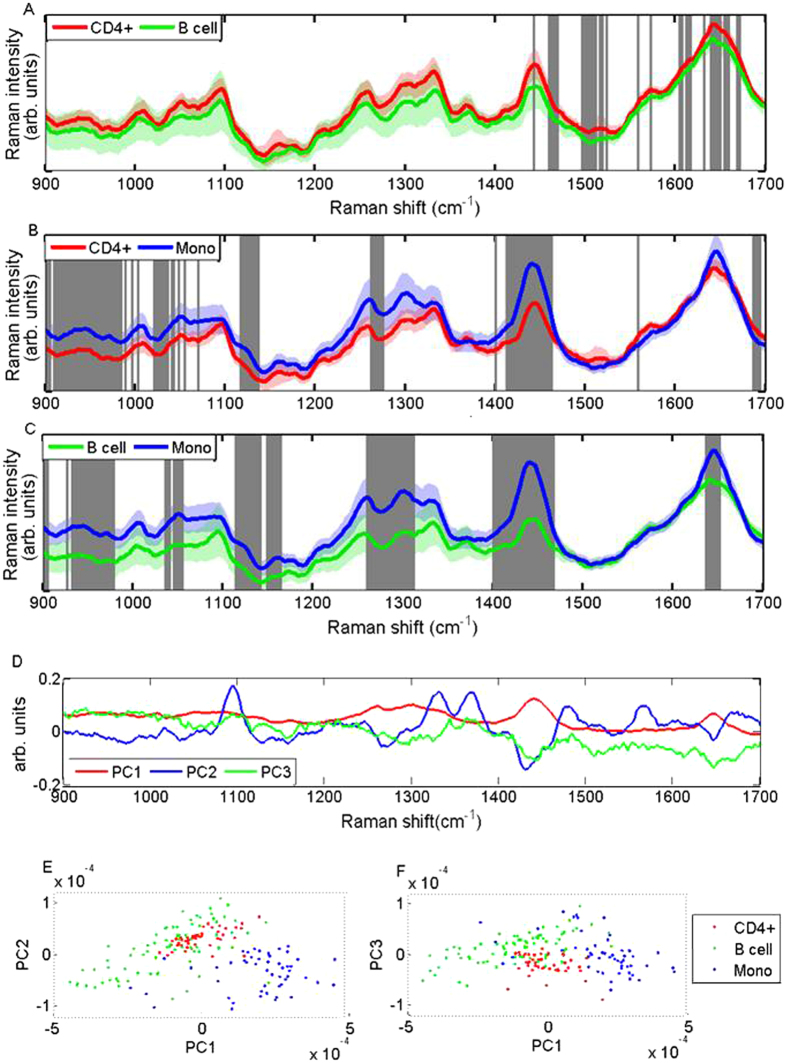
(A–C) Standard Raman spectra collected on the multi-modal system illustrating pairwise comparisons between CD4+ T cells, B cells and monocytes. Solid lines show the mean spectrum for each cell subset and shadowed regions represent one standard deviation. Grey vertical bars indicate the regions of most significant difference between cells, as calculated by the student’s t-test at a significance level of (A) p < 10−8, (B) p < 10−13, and (C) p < 10−18. (D) illustrates the loadings for the first 3 PCs from all cell types. The 1st, 2nd, and 3rd PCs are shown in red, blue and green respectively. (E,F) demonstrate scatter plots for the whole data set using the first 3 PCs. Distinct clusters for each cell subset demonstrate the ability to discriminate between cell types using RS.

