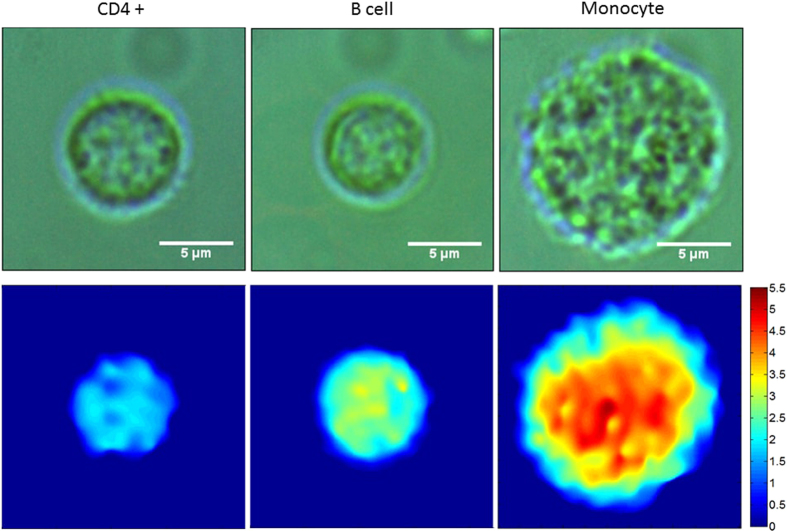
Figure 2. The top row shows example bright field images for each of CD4+ T cell, B cell, and monocyte cells (left to right).
Scale bars denote 5 μm in length. The bottom row represents respective phase images showing the phase difference between the signal and reference arm. The intensity is related to the optical path difference between the reference and signal arms which can be related to both absolute cell thickness and intracellular structure. Colour bar denotes the phase difference in the unit of radian.

