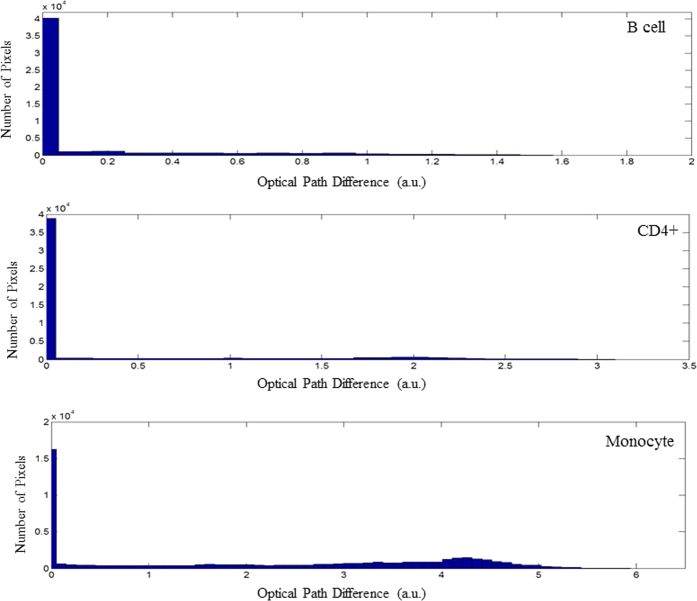
Figure 3. An example histogram for each of B cell, CD4+ T cell, and monocyte cell subsets.
The histogram illustrates the number of pixels which relate to specific OPD values for a single cell phase map. Cells which induce a greater OPD between the signal the reference arm will have high OPD values, smaller cells will have a greater number of zero-value pixels. All phase map images are made up of 220 × 220 pixels.

