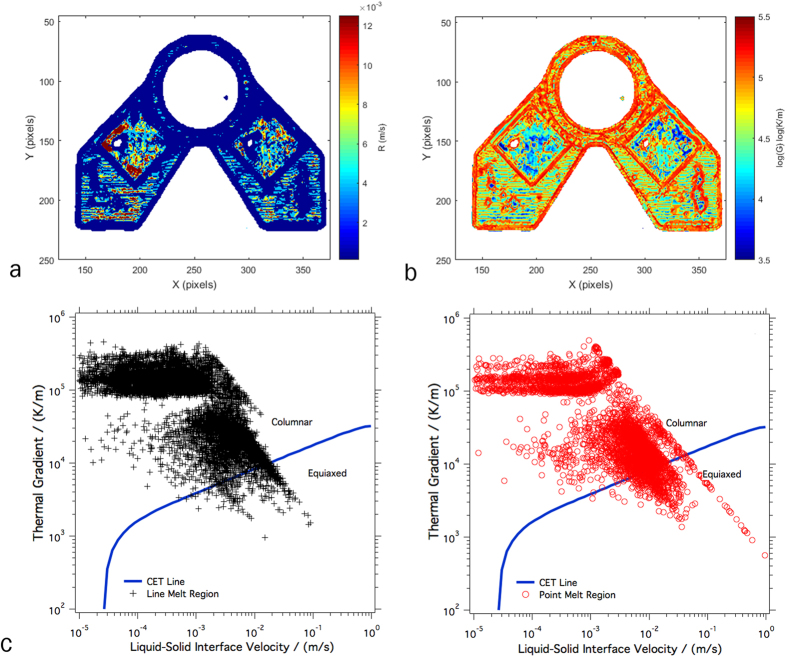
Figure 15.
The layer Thermal Gradients (a), Interface Velocity (b), and CET curve (c). The interface velocity contour (a) shows that in the regions that are subject to the point melt strategy the velocity is relatively higher than the rest of the build. In the thermal gradient contour (b) the line melt regions tend to show gradients that are generally higher than the regions that underwent the point melt strategy. This follows with the literature and when all of the points are plotted on a columnar to equiaxed transition curve (c) there is a shift for the equiaxed region points toward the equiaxed region of the chart.

