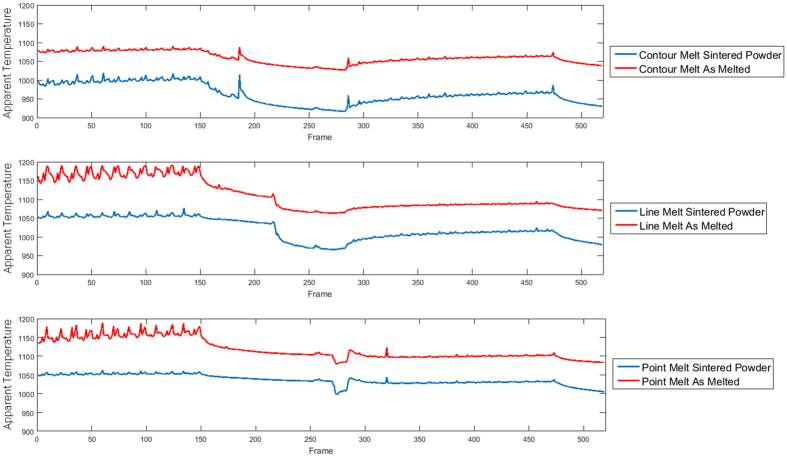
Figure 5. The Temperature Outputs from calibrations in FLIR’s ResearchIR software.
Each chart created using FLIR’s software shows a different point in the build that underwent a differing scan strategy, the top shows the scan strategy for a point in the build that underwent the point melt strategy; the second, a contouring melt outlining the geometry of the layer; and the third shows a line melt strategy. The red line in each figure represents the calibration for the part as printed while the blue line shows the temperature of the point as calibrated for powder.

