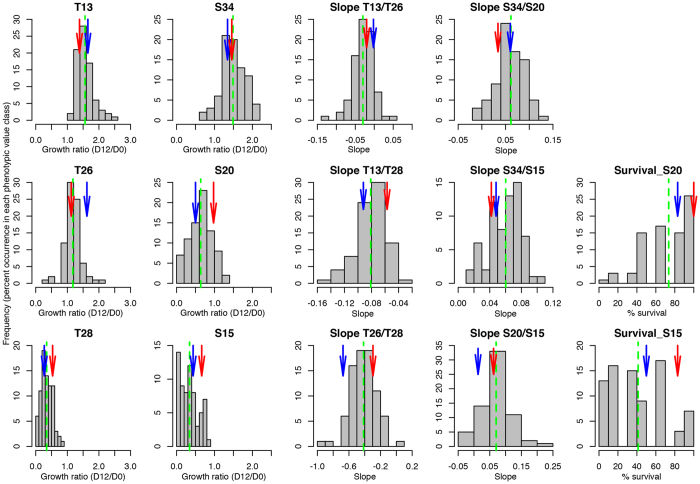
Figure 1. Distributions of the progeny BLUPs of the studied traits.
T13, T26 and T28 correspond to growth rate phenotypes for temperatures 13 °C, 26 °C and 28 °C respectively. S34, S20 and S15 correspond to growth rate phenotypes for 34‰ salinity, 20‰ and 15‰ respectively. Plasticity traits are represented by a letter followed by a number and a slash, then another letter and number. For example, S34/S20 corresponds to plasticity represented by slope of the reaction norm between salinity 34‰ condition and salinity 20‰ condition. Surv_S15 and Surv_S20 correspond to survival trait for conditions salinity 15‰ and salinity 20‰. Frequency distributions of the progeny BLUPs of the analyzed traits; blue arrows indicate mean values for the male parent and red arrows indicate mean values for the female parent; the green dashed line represents the mean value for the progeny population; “Slope” represents the slope values of the reaction norm between two conditions indicated at the top of each graph; “% survival” represents the proportion of survival among replicates of each progeny for salinity conditions 15‰ and 20‰.

