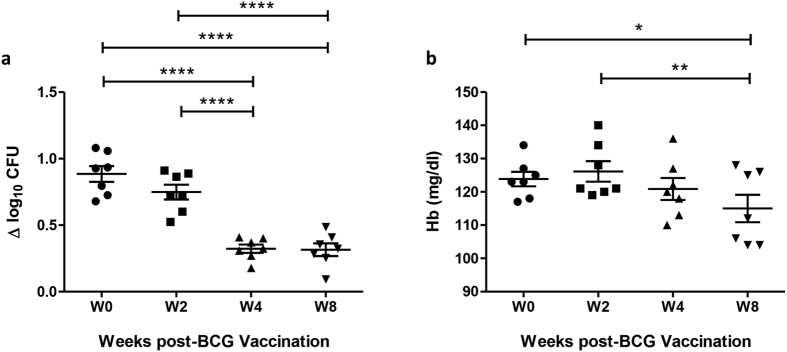
Figure 3. Reduction in Mycobacterial growth and Hb concentration following BCG vaccination and successive bleeds in Rhesus macaques.
(a) The MGIT assay was performed using BCG Pasteur and (b) Hb measured pre- and post-BCG vaccination using whole blood from 7 Rhesus macaques. Points represent the mean of duplicates from individual animals and bars represent the mean values with SEM. Shapes represent different time-points. Having passed a normality test, a repeated measures ANOVA was performed followed by a Bonferroni post-test where *represents a p-value of <0.05, **represents a p value of <0.005, and ****represents a p-value of <0.0001. Δ log10 CFU = (log10 CFU of sample − log10 CFU of control).

