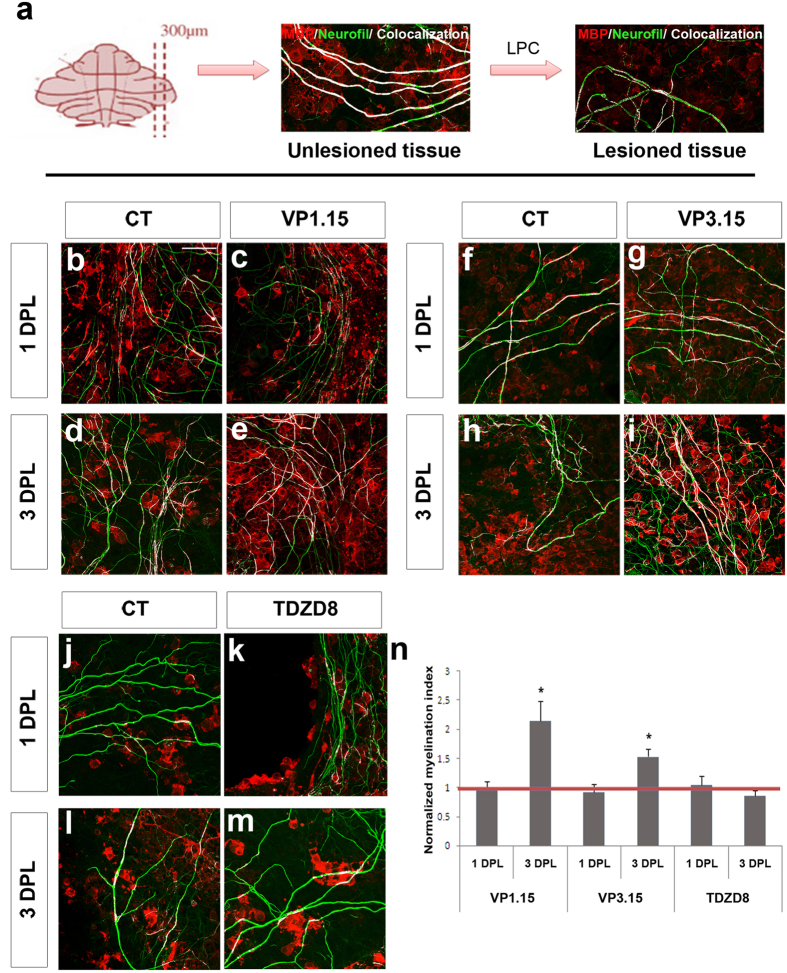
Figure 3. PDE7-GSK3 inhibition favors remyelination after demyelination by LPC in cerebellar slices.
(a) Immunofluorescence images showing cerebellar slices with or without treatment with LPC (0.5 mg/ml). Untreated tissue shows most axons (green) wrapped by oligodendrocytes (red). After induction of demyelination with LPC, most oligodendrocytes were lost. (b–m) Images show tissue after 1 and 3 days post-lesion (DPL) where oligodendrocytes (red) and axons (green) can be observed and the overlapping areas (white) show myelinated fibres after treatment with 5 μM of VP1.15 (b–e), VP3.15 (f–i) or TDZD8 (j–m). (n) Plot showing the normalized myelination index which represents the co-localization area with respect to the total area occupied by fibers and normalized with respect to the control values to which a value of 1 was assigned (red line). The treatment with inhibitors for 24 h (1DPL) did not induce an observable effect on demyelinated slices, showing that the baseline between conditions is similar, but when the treatment was extended for 48 more hours (3DPL) a positive effect on remyelination was observed withPDE7-GSK3 inhibition with both VP1.15 and VP3.15. TDZD8 showed no effect. Scale bar represents 25 μm for (a–d). Values are given as mean ± SEM and the results of Student’s t test are represented as *p < 0.05, **p < 0.01, and ***p < 0.001.

