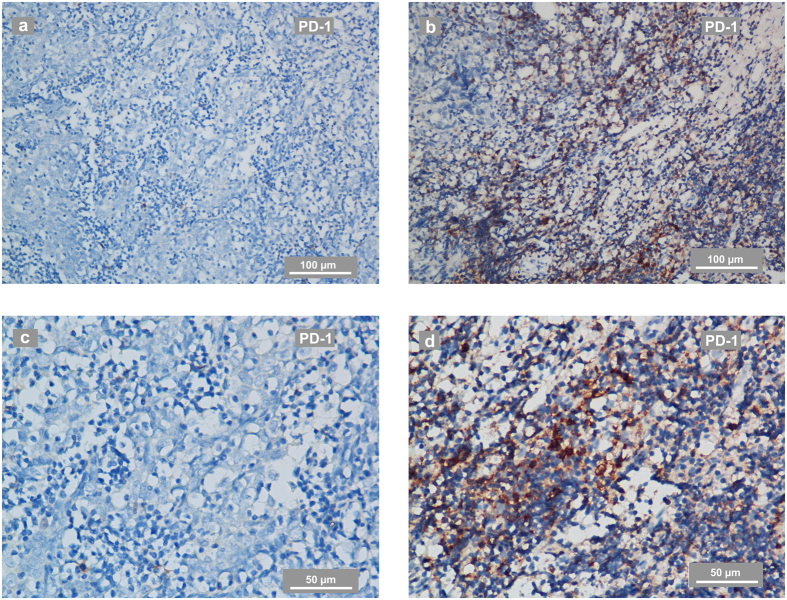
Figure 1. Representative IHC staining of PD-1 in NPC-biopsies.
(a,c) PD-1 staining in a biopsy from an NPC patient evaluated as PD-1 negative. The IHC photos were taken using phase-contrast microscopy and are shown at low (a) and high magnification (c). (b,d) PD-1 staining in a biopsy from an NPC patient evaluated as PD-1-positive. The IHC photos are shown at low (b) and high magnification (d). The scale bars for a-b are 100 μm and for c-d are 50 μm.

