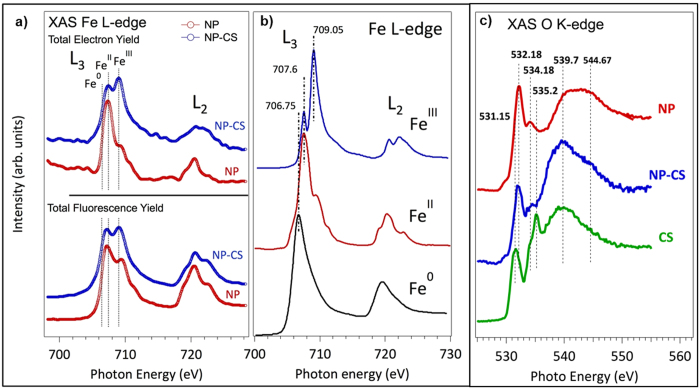
Figure 1.
(a) Comparison of TFY and TEY Fe L2,3-edge XANES of the nano-MOFs before (NP) and after (NP-CS) CS absorption. (b) Reference Fe L2,3-edge XANES in three different model compounds with different number of d–electrons, coordination numbers and with different formal charges, i.e. metal (Fe0), FeCl2 (FeII) and Fe2O3 (FeIII). (c) XANES O K-edge spectra of the nano-MOFs (NP)- before and after CS absorption, using TFY detector.

