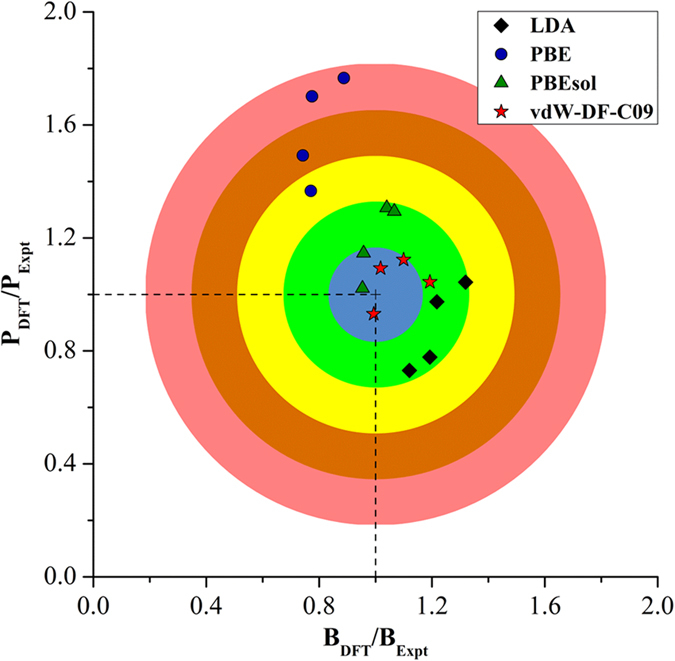
Figure 2. Comparison of bulk modulus (BDFT) and spontaneous polarizations (PDFT) of PTO, BTO, and KNO in the different crystal phases relative to the experimental values.

Each color region represents the DFT/Experiment ratio of ±0.165.

Each color region represents the DFT/Experiment ratio of ±0.165.