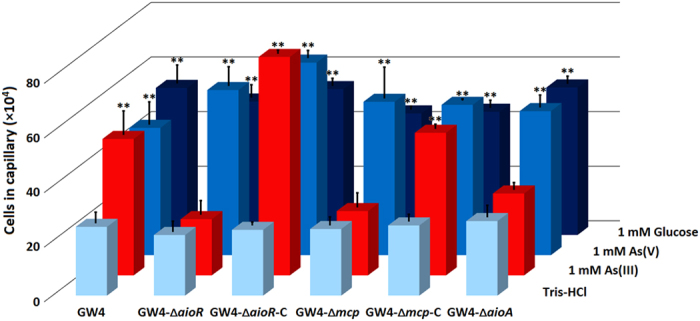
Figure 2. Quantification of the chemotactic response towards 1 mM As(III), 1 mM As(V) or 1 mM glucose of A. tumefaciens strains.

Data were obtained from quantitative capillary assays. Tris-HCl (pH = 7.0) was used as a negative control. Results represent the means from at least three independent experiments and the error bars indicate standard errors. Stars represent statistical significance (**p < 0.01).
