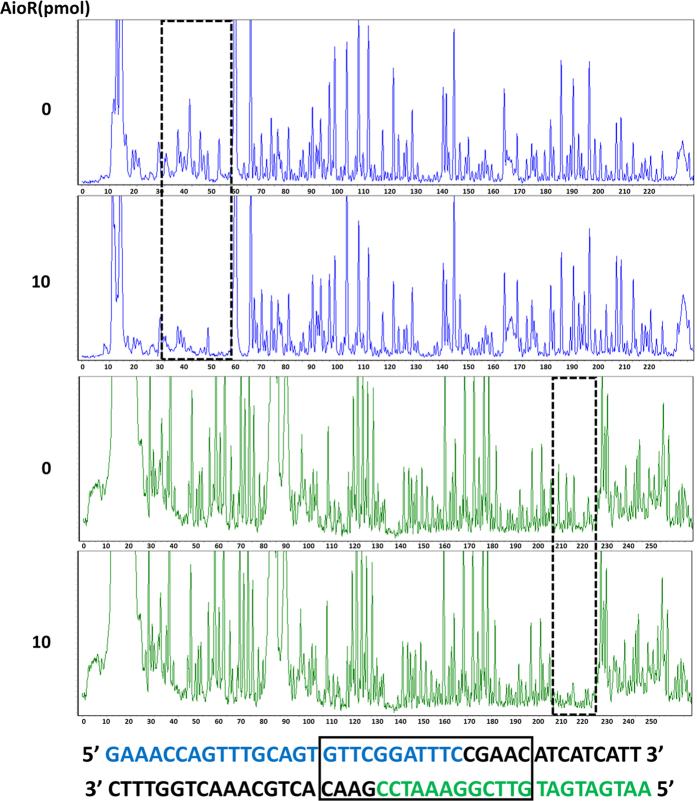
Figure 7. DNase I foot-printing assays for the mcp loci. Electropherogram-based visualization for protection pattern of mcp promoter after digestion with DNase I following incubation with (in the bottom, 10 pmol) or without (on the top, 0 pmol) AioR protein.
The fluorescence signal of the labeled DNA fragments (FAM-labeled sense strand and HEX-labeled antisense strand) is plotted against the sequence length of the fragment. The DNase I foot-printing analysis data of both strands are showed below and the protected region is framed.

