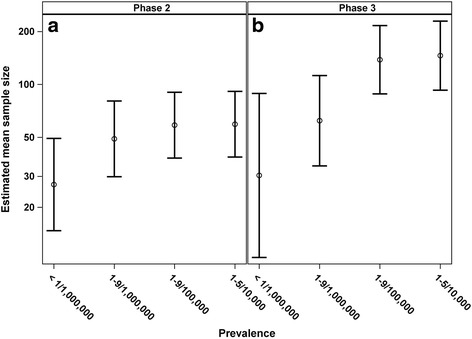
Fig. 2.

Fitted mean of sample size and 95% confidence interval back transformed from logarithmic values by class of prevalence and phase of trial adjusted for interaction between prevalence, phase of study and the interaction between prevalence and phase, adjusted for gender, age, whether or not the trial had a DMC, whether or not the intervention was FDA regulated, intervention model, trial regions, number of countries participating in the trial, year that enrolment to the protocol begins and number of arms
