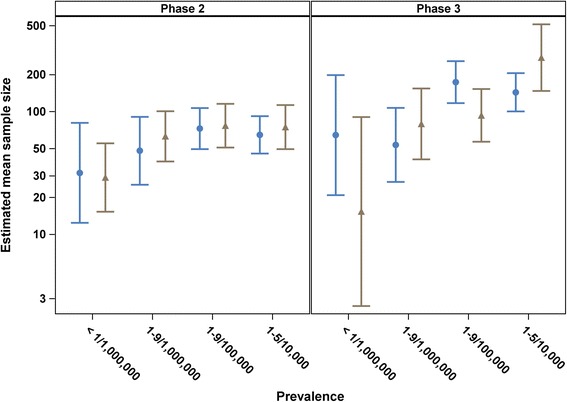
Fig. 5.

Fitted mean of sample size and 95% confidence interval back transformed from logarithmic values by class of prevalence and phase of trial adjusted for interaction between prevalence, phase of study and the interaction between prevalence and phase for parallel 2-arm trials only (blue) and single group (1-arm) trials only (brown). Both fitted models were adjusted for other covariates (see Table 5)
