
Fig. 5.
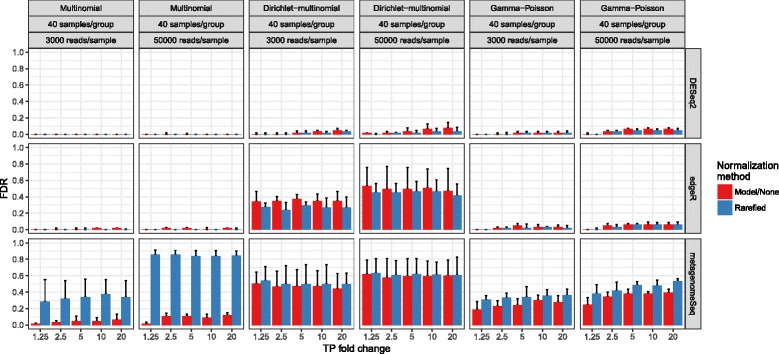
Differential abundance detection false discovery rate with varied library sizes that are approximately even on average between groups. For simplicity, only those methods where the FDR exceeds or is close to 0.05 are shown. Full methods are in Additional file 7: Figure S6. Labels are the same as in Fig. 4