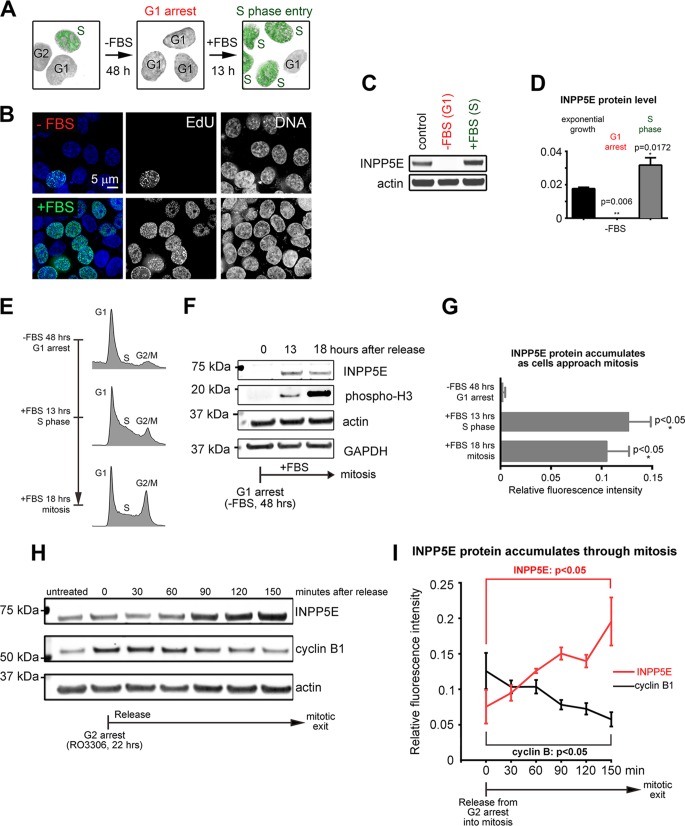
FIG 6.
INPP5E protein expression is cell cycle dependent. (A and B) Serum starvation-induced G1 arrest in HCT cells. (C) Decreased endogenous INPP5E in HCT cells arrested in G1 via serum starvation. (D) Quantification of infrared Western blotting results shown in panel C. P values were calculated via ANOVA with Sidak's multiple-comparison test (3 replicates). (E) Representative cell cycle flow cytometry profiles of cells at the indicated time points after release from starvation-induced G1 arrest. (F) INPP5E accumulates as cells progress through the cell cycle. (G) Quantification of INPP5E protein levels at the indicated time points. P values for INPP5E were determined using unpaired t tests (n = 3 replicates). (H) Western blots of HeLa cell lysates released from RO3306-induced G2 arrest at the indicated time points. (I) Quantification of INPP5E and cyclin B1 protein (normalized to actin, n = 3 replicates) at the indicated time points. P values were calculated by one-way ANOVA.

