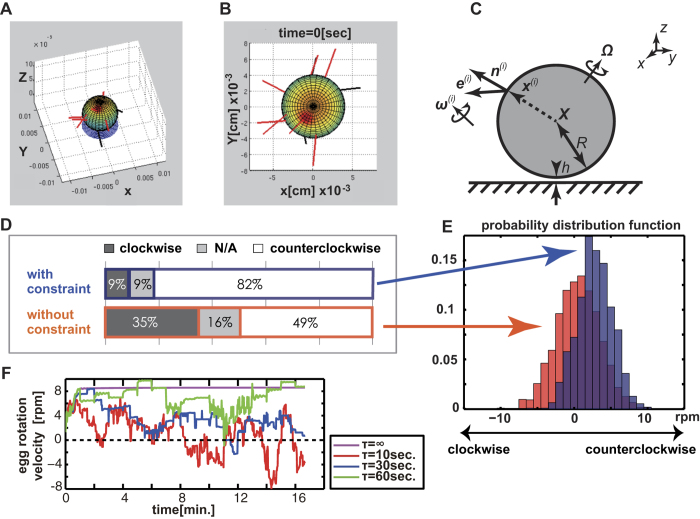
Figure 3. Simulation of the counterclockwise egg rotation.
(A) A schematic illustration of our mathematical model of the egg rotation. The eggs were colored for presentation and are located near a bottom substrate, while the spermatozoa are depicted by red and black rods. The modeling is such that the spermatozoa in red are active, and generate forces and torques. In contrast, the black spermatozoa (with flagella intersecting the substrate, as shown in A and B) do not exert any force or torque on the egg (Simulation 2 to Simulation 4). (B) Top view of a snapshot of the typical movement of the egg simulated in the model fixed to the egg center. (C) The mathematical description of the model of a sperm-egg complex. Multiple rod-like spermatozoa were connected to a spherical egg located near a bottom substrate with a finite separation. The details of the symbols and the model are given in Methods. (D) The direction of the simulated egg rotation based on the model with and without the restriction on the spermatozoa that penetrated the substrates (Simulation 1 and 2), obtained by 2000 simulations with random initial sperm binding site. Each simulation was done with a randomized initial sperm binding site (Simulations 1 and 2). The figure illustrates the distribution of egg rotation velocity at t = 10 sec, as obtained in D. (F) Typical time evolution of rotation velocity of a sperm-egg complex with the sperm detach-attach process (Simulation 4). Note that the rotation direction may reverse occasionally when the sperm attachment sites are changed during the simulation process. Color indicates the simulation with a different detach-attach time period τ (Method).

