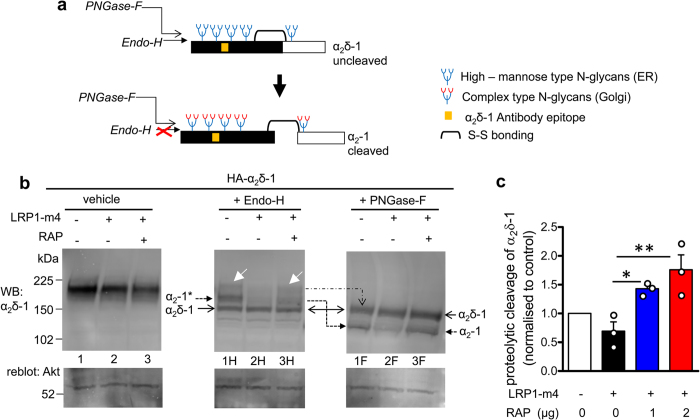
Figure 7. Effects of RAP and LRP1-m4 on α2δ-1 subunit trafficking impacts their glycosylation pattern and post-translational proteolytic cleavage.
(a) Schematic representation of the different species of α2δ-1 N-glycosylation associated with proteolytic processing, indicating that the cleaved α2-1 is resistant to Endo-H treatment after its processing in the Golgi. (b) Western blot analysis: WCL from tsA-201 cells expressing HA-α2δ-1 either alone (lane 1), with Flag-LRP1-m4 (lane 2) or with Flag-LRP1-m4 and 1 μg RAP (lane 3). Top panel: α2δ-1 (α2-1 mAb), bottom panel, reblot for Akt loading control. Left panel shows glycosylated α2δ-1 (lanes 1–3), which does not resolve the different species of α2δ-1. Endo-H treatment (middle panel; lanes 1H-3H), targeting only the high–mannose (ER–associated), but not the complex (Golgi–associated) N-glycans, shows that cleaved α2-1 is resistant to Endo-H (α2-1* species; solid arrowhead on left), whereas uncleaved pro-α2δ-1 is sensitive to Endo-H (α2δ-1 species; open arrowhead on left). White arrows on blot shows a minor fraction of the uncleaved pro-α2δ-1, which is Endo-H resistant. Note that Endo-H-resistant (Golgi-associated) species of α2δ-1 are reduced upon co-expression of Flag-LRP1-m4 (middle panel; lane 2H), which is reversed by co-expression of RAP (middle panel; lane 3H). PNGase-F treatment (right panel; lanes 1F-3F) caused removal of all types of N-glycans from both cleaved α2-1 and uncleaved α2δ-1 (arrows on right). Note that cleavage of α2-1 is reduced upon co-expression of Flag-LRP1-m4, and this is reversed by co-expression of RAP (α2-1 species; compare lanes 2F and 3F). Representative of n = 2 experiments. (c) Quantification of α2δ-1 proteolytic processing expressed as a ratio of cleaved α2-1 to total α2δ-1 (cleaved + uncleaved) in PNGase-F deglycosylated WCL, normalised to control conditions (open bar), in the presence of LRP1-m4 (black bar) or LRP1-m4 plus 1 μg or 2 μg RAP cDNA (blue and red bars respectively). Data are mean ± SEM with individual data points for n = 3 independent experiments. **P < 0.01, *P < 0.05, 1-way ANOVA and Bonferroni’s post-hoc test. Full blots for all figure parts are shown in Supplementary information.

