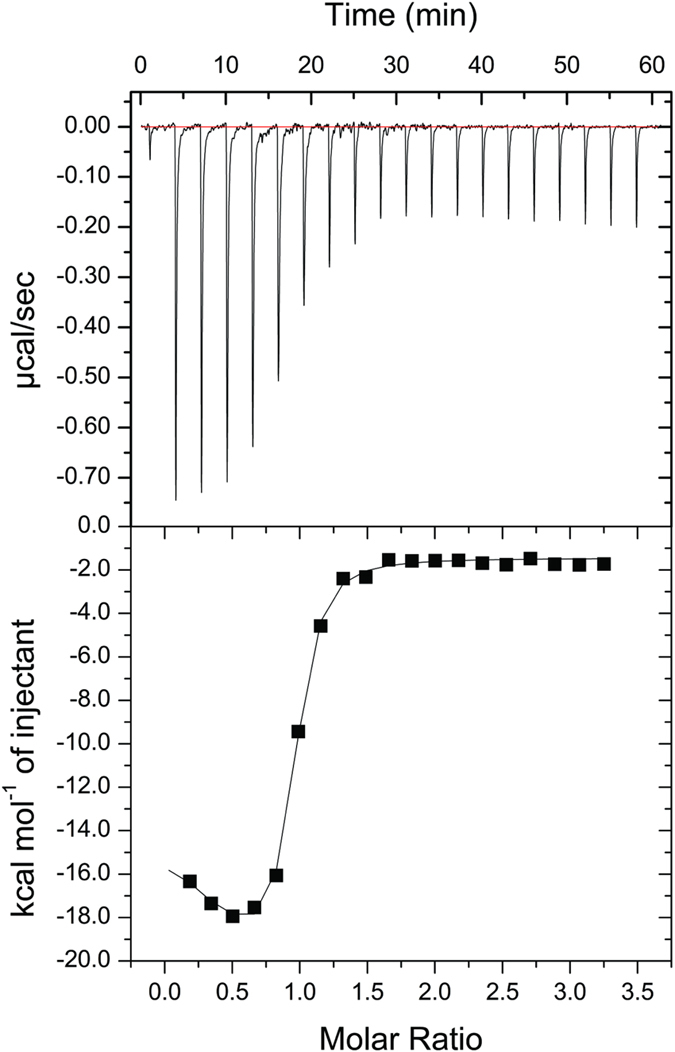
Figure 2. Isothermal titration calorimetry (ITC) of CA (240 μM) into CB (15 μM) in 50 mM ammonium formate (50 mM), pH 6.6, at 25 °C.

(Top) Raw data thermogram representing the equipment response (μcal/s) as a function of time (minutes) of the titration and (Bottom) binding isotherm with enthalpy change (kJ/mol of injectant) versus CA-CB molar ratio.
