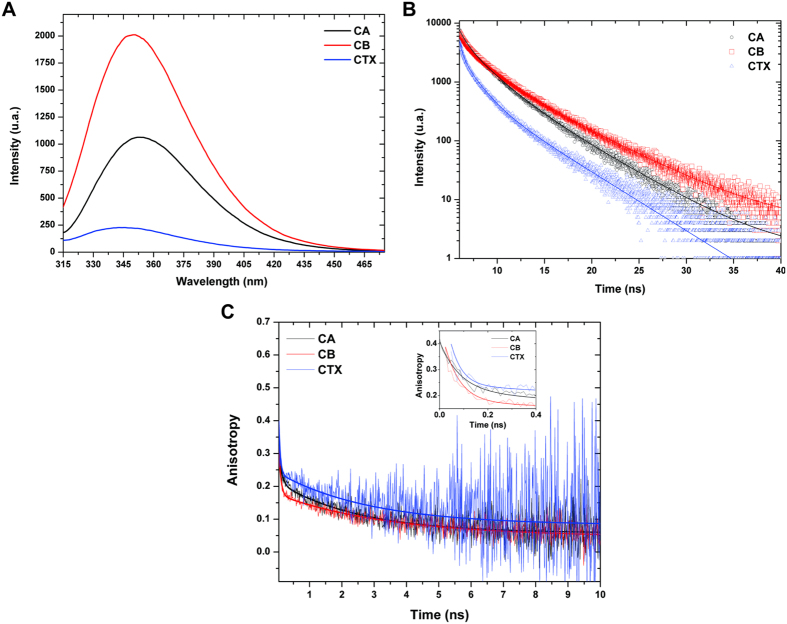
Figure 3. Fluorescence spectroscopy experiments with crotoxin (CTX) and its isolated subunits, crotoxin A (CA) and crotoxin B (CB).
(A) Steady-state spectroscopy fluorescence of tryptophans from CA (black line); CB (red line) and CTX (blue line). (B) Time-resolved fluorescence of tryptophans measured at λem 360 nm from CA (black line and circles), CB (red line and squares) and CTX (blue line and triangles). (C) Time-resolved fluorescence anisotropy measured at λem 360 nm for tryptophan residues from CA (black), CB (red) and CTX (blue). The inset highlights the first 0.4 nanoseconds from time-resolved fluorescence anisotropy data.

