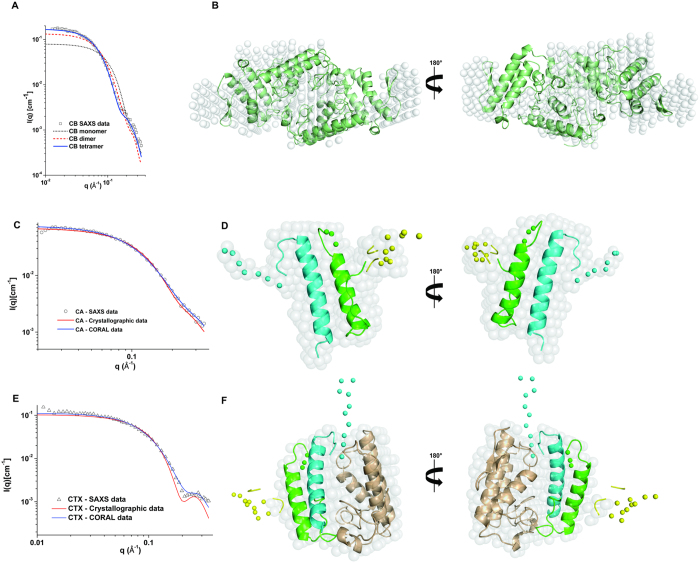
Figure 5. Small angle X-ray scattering models of CTX and CA and comparison of theoretical SAXS curves from crystal and structural models with experimental SAXS curves of crotoxin (CTX), crotoxin A (CA) and crotoxin B (CB).
(A) Fitting of monomer (black dots), dimer (red dashes) and tetramer (blue line) of crotoxin B to experimental CB SAXS data (black squares). (B) Superposition of crystal structure of CB (in green cartoon) on SAXS dummy chain model (white transparent surface) and after 180° rotation. (C) Fitting of theoretical SAXS curves from crystallographic data of CA (red line) and SAXS model of CA modeled in CORAL software43 with loops that were absent in the CA crystal structure (blue line) in experimental CA SAXS data (black circles). (D) Cartoon representation of CA model obtained in CORAL software superposed on its SAXS dummy chain model (white transparent surface) and after 180° rotation. Chains α, β, γ are shown in green, blue and yellow, respectively. The loops modeled as dummy atoms by CORAL software are shown as solid spheres. (E) Fitting of theoretical SAXS curves from crystallographic data of CTX (red line) and SAXS model of CTX obtained by CORAL (blue line) from experimental CA SAXS data (black triangles). (F) Cartoon representation of CTX model obtained in CORAL superposed on its SAXS dummy chain model (white transparent surface) and after 180° rotation. Chains α, β, γ of CA are shown in green, blue and yellow, respectively. CB is shown in brown. The loops of CA modeled as dummy atoms by CORAL are shown as solid spheres.

