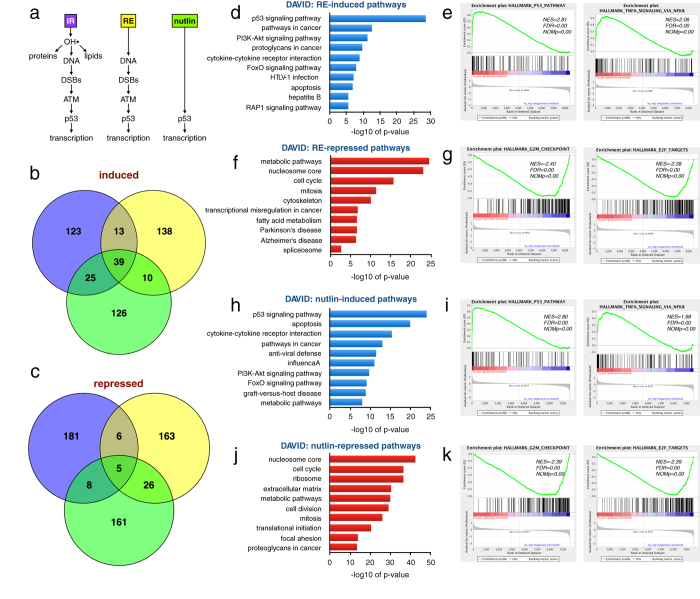
Figure 2. Comparing transcriptional responses to IR, restriction enzyme (RE)-induced DSBs and the p53 activator Nutlin-3.
(a) IR induces damage to DNA, proteins and lipids while induction of the restriction enzyme AsiSI only causes DNA DSBs and Nutlin-3 induces p53 without DNA damage. (b) Venn diagram comparing the top 200 induced genes for the three different treatments. There were 39 genes induced by all three treatments. (c) Venn diagram comparing the top 200 repressed genes for the three treatments. Only 5 genes were repressed by all three of the treatments. (d) DAVID functional annotation analysis of genes induced >1.5-fold following 4 hours of ER-AsiSI activation by tamoxifen. (e) Top Hallmark pathways “p53 pathway” and “TNF signaling by NFkB” induced by RE listing the normalized enrichment score (NES), false discovery rate q-value (FDR) and the nominal p-value (NOMp). (f) DAVID analysis of genes suppressed >1.5-fold following 4 hours of ER-AsiSI activation by tamoxifen. (g) Top Hallmark pathways “G2/M checkpoint” and “E2F targets” suppressed by RE. (h) DAVID functional annotation analysis of genes induced >2-fold following 6 hours of nutlin-3 treatment. (i) Top Hallmark pathways “p53 pathway” and “TNFA signaling by NFkB” induced by nutlin-3. (j) DAVID analysis of genes suppressed >2-fold following 6 hours of Nutlin-3 treatment. (k) Top Hallmark pathways “G2/M checkpoint” and “E2F targets” suppressed by Nutlin-3.

