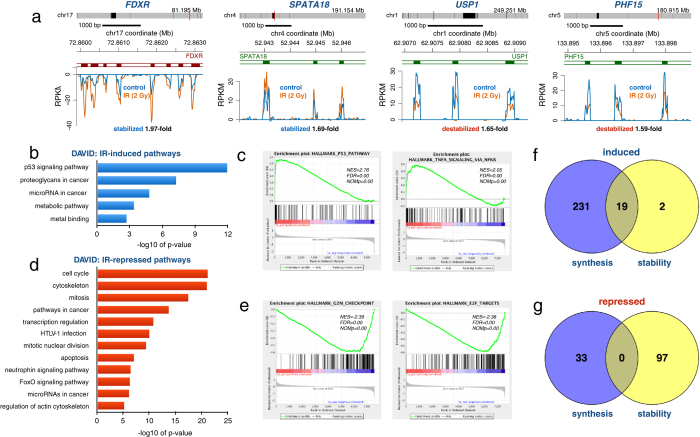
Figure 3. IR affects RNA stability.
(a) The FDXR and SPATA18 transcripts were stabilized while the USP1 and PHF15 transcripts were destabilized by IR as measured by BruChase-seq. HF1 cells were Bru-labeled for 30 min and then irradiated with 2 Gy (orange trace) or not (control blue trace) and chased in uridine for 6 hours. (b) DAVID functional annotation analysis of 21 transcripts significantly stabilized according to DESeq (n = 2). (c) Top Hallmark pathways “p53 pathway” and “cholesterol homeostasis” induced by IR, listing the normalized enrichment score (NES), false discovery rate q-value (FDR) and the nominal p-value (NOMp). (d) DAVID functional annotation analysis of 97 transcripts significantly destabilized according to DESeq (n = 2). (e) Top Hallmark pathways “E2F targets” and “G2/M checkpoints” of transcripts destabilized by IR. (f) Venn diagram showing the correlation between genes up regulated either by transcription (231), stability (2) or both (19). Data is from Supplemental Tables 1 and 5. (g) Venn diagram showing the correlation between genes down regulated either by transcription (33), stability (97) or both (0). Data is from Supplemental Tables 1 and 5.

