Fig. 3.
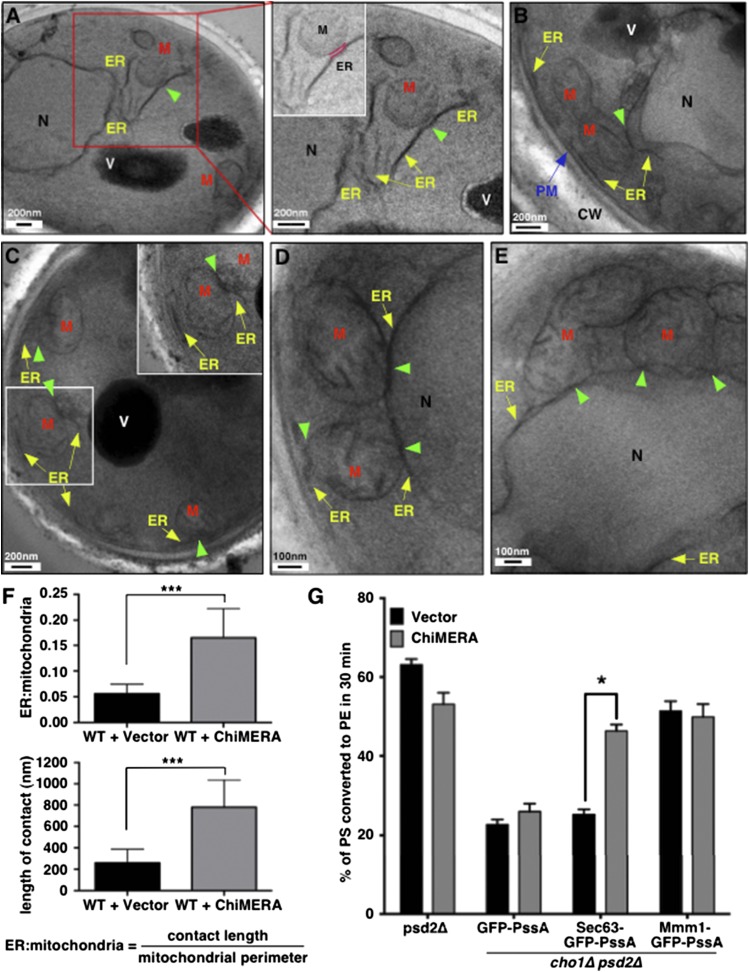
Increasing ER-mitochondria contacts increases PS transport to mitochondria. A–E: WT cells expressing empty vector (A) or ChiMERA (B–E) were visualized by EM. Boxed regions are shown in higher magnification. ER-mitochondria contact is highlighted in pink in the inset of the right panel of (A). Yellow arrows denote ER membrane. Green arrowheads indicate contact sites between the ER and mitochondria. The blue arrow denotes plasma membrane. M, mitochondria; V, vacuole; N, nucleus; PM, plasma membrane; CW, cell wall. F: Quantification of length of contact between ER and mitochondria for experiments in (A–E). The top panel shows the average ER-mitochondria ratio and the lower panel shows the average length of contacts (mean ± SD, n = 15 individual cells). The ER-mitochondria ratio was determined by measuring the length of contacts between the ER and mitochondria divided by the length of mitochondrial perimeter in each image. ***P < 0.005, independent two-tailed t-test. G: The indicated strains were labeled with [3H]serine for 30 min and the percentage of [3H]PS converted to [3H]PE was determined (mean ± SD, n = 3 independent experiments). *P < 0.05, independent two-tailed t-test. Raw data used to calculate percent of [3H]PS converted to [3H]PE is in supplemental Fig. S2C, D.

