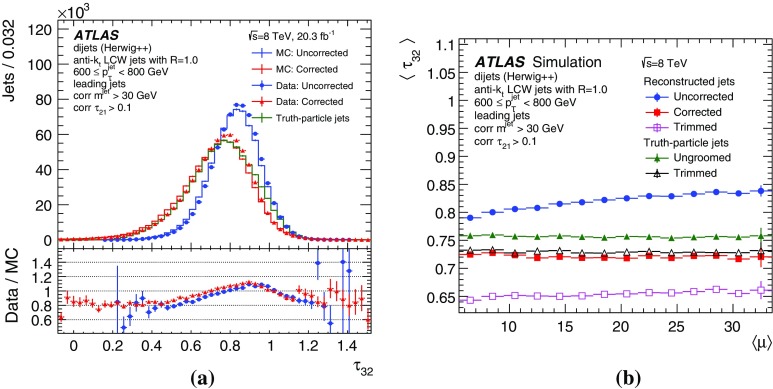
Fig. 8.
a Comparisons of the uncorrected (filled blue circles), corrected (red) distributions of the ratio of 3-subjettiness to 2-subjettiness () for data (points) and for MC simulation (solid histogram) for leading jets in the range . The distribution of computed using stable truth particles (filled green triangles) is also included. The lower panel displays the ratio of the data to the MC simulation. b Dependence of on for the uncorrected (filled blue circles), corrected (filled red squares) and trimmed (open purple squares) distributions for reconstructed jets in MC simulation for leading jets in the range . The mean value of computed using stable truth particles (green) is also included

