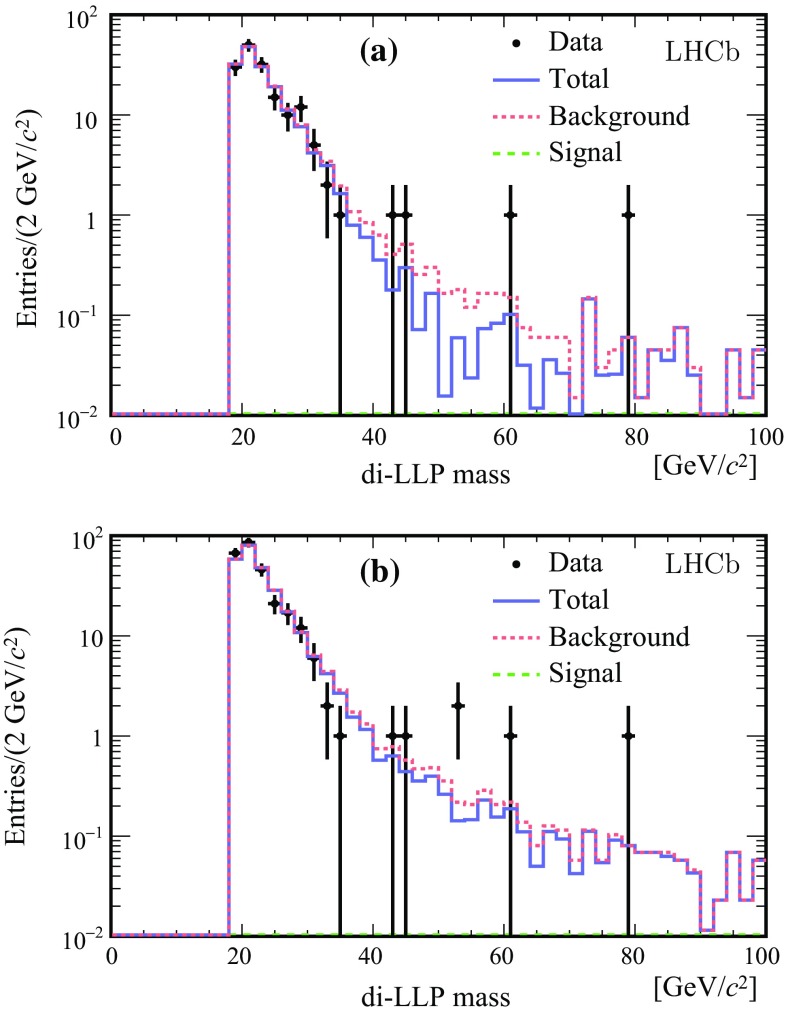
Fig. 5.
Results of the fit based on the model BV48 10ps mH114, for different combinations of signal and background selections, a signal from and background from , b signal from and background from . Dots with error bars are data, the dashed (green) line is the fitted signal and the dotted (red) line the background. In both cases the fitted signal is negative. The histogram (blue) is the total fitted function

