
Figure 2. The correlation between observed KD (KDobs), mixing time and HSA concentration for caffeine binding (reported KD ~1.5 mM).
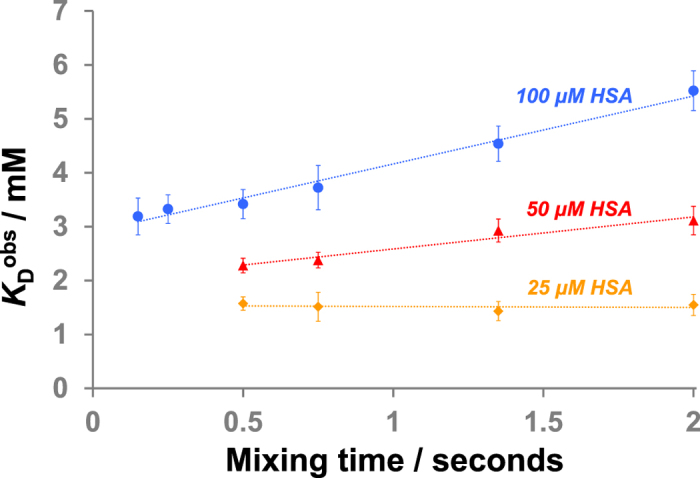
Error bars show standard errors from three separate experiments. Dotted lines are added to aid visualisation.
Official websites use .gov
A
.gov website belongs to an official
government organization in the United States.
Secure .gov websites use HTTPS
A lock (
) or https:// means you've safely
connected to the .gov website. Share sensitive
information only on official, secure websites.
Error bars show standard errors from three separate experiments. Dotted lines are added to aid visualisation.