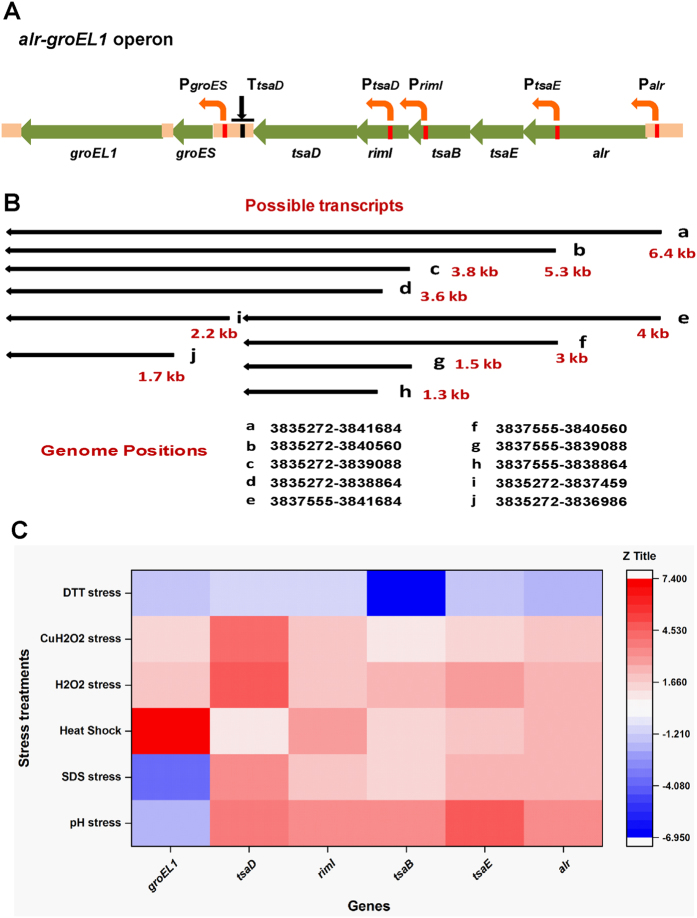
Figure 5. Relative expression of the constituent genes of alr-groEL1 operon under various stress conditions.
(A) A schematic representation of the positions of promoters (indicated by red bars) and possible pause signal/ transcription regulatory elements (represented by black bars). (B) The alr-groEL1 multi-transcript map representing a probable outcome of previous experiments. Genome position for each transcript is indicated to estimate its approximate size. (C) A heatmap with colour variations referring to the changes in expression levels of the individual genes. Colour scale is represented by z title. Colour approaching red denotes upregulation while downregulation is represented by increasing blue colour. RT-qPCR was done on total RNA from M. tuberculosis H37Rv subjected to various stresses that include heat shock at 42 °C, SDS (0.1%), pH 4.5, H2O2 (5 mM), cumene hydroperoxide (5 mM), DTT (1 mM). In all cases, the bacteria were kept under stress for approx. 2 h except for heat shock which was given for 30 min. The results (fold change observed) were normalized to the expression of the 16S rRNA reference gene. The results shown are the representative of three independent experiments.

