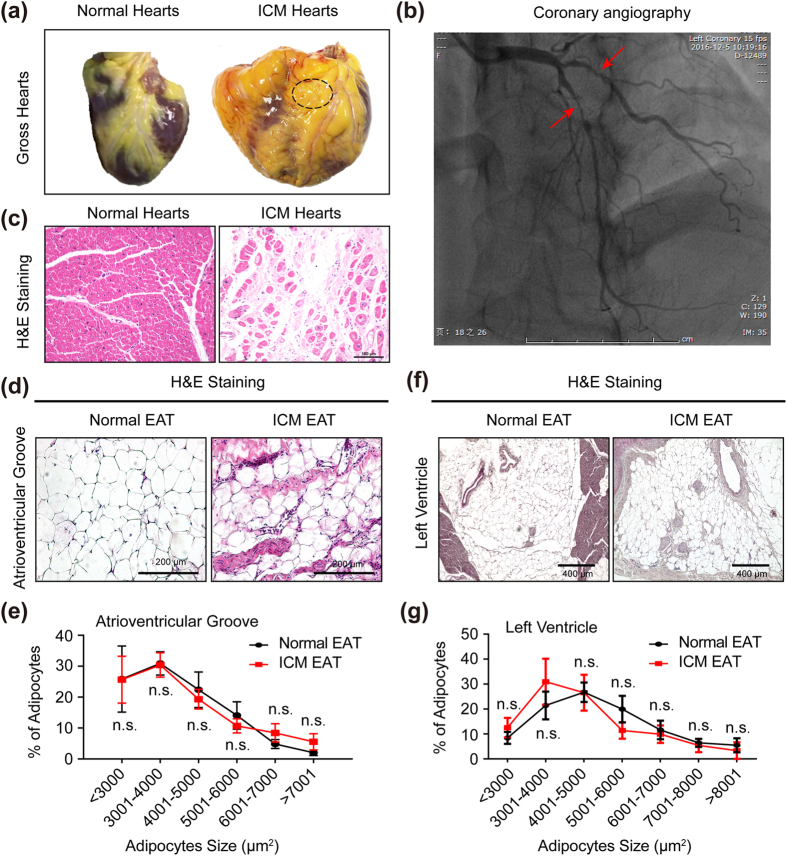
Figure 1. The essential features of EAT in normal donors and ICM patients.
(a) The gross hearts of normal donor and ICM patient, and black dotted circle indicated the site of EAT we harvested (n = 12–16 samples); (b) The represented image of coronary angiography of ICM patients; (c) H&E staining of myocardium in left ventricle (n = 12–16 samples, scale bar, 100 μm); (d,f) H&E staining of EAT in atrioventricular groove (d) and left ventricle (f) of normal donors and ICM patients (n = 12–16 samples, left panel scale bar, 200 μm; right panel scale bar, 400 μm); (e,g) The statistical results of adipocyte size in atrioventricular groove EAT (e) and left ventricle EAT (g) of normal donors and ICM patients (n = 12–16 samples). n.s. indicated no significance.

