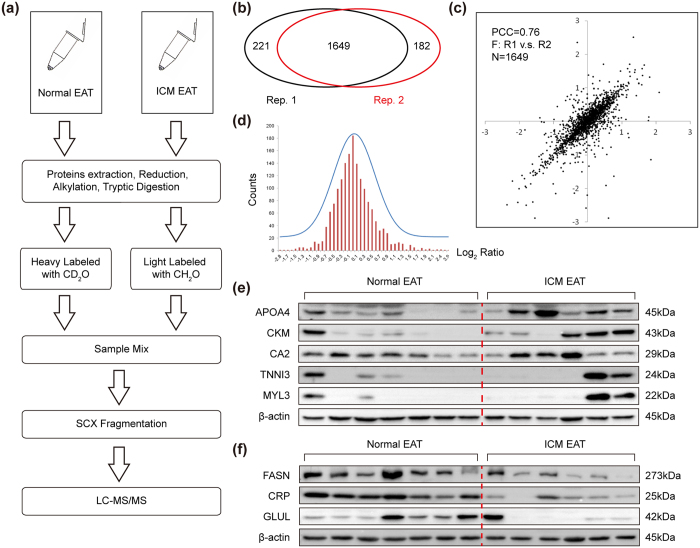
Figure 2. Experimental workflow and verification of quantitative proteomics.
(a) Flowchart of the quantitative proteomics experiments; (b) A total of 2052 proteins was successfully quantified in the two experiment replicates, among which 1649 proteins were overlapped; (c) Pearson Correlation analysis shows a Pearson Correlation Coefficient (PCC) of 0.76 for the 1649 overlapping proteins in the two replicates; (d) Gaussian distribution of the quantitative data (Log2 (Ratio)) shared by the two experimental replicates, the mean value was 0.0035 and SD value was 0.538; (e) The protein levels of APOA4, CKM, CA2, TNNI3, and MYL3 in EAT of normal donors and ICM patients (n = 6–7 samples); (f) The decreased proteins (FASN, CRP, and GLUL) confirmed by western blots (n = 6–7 samples). The β-actin was served as loading control.

