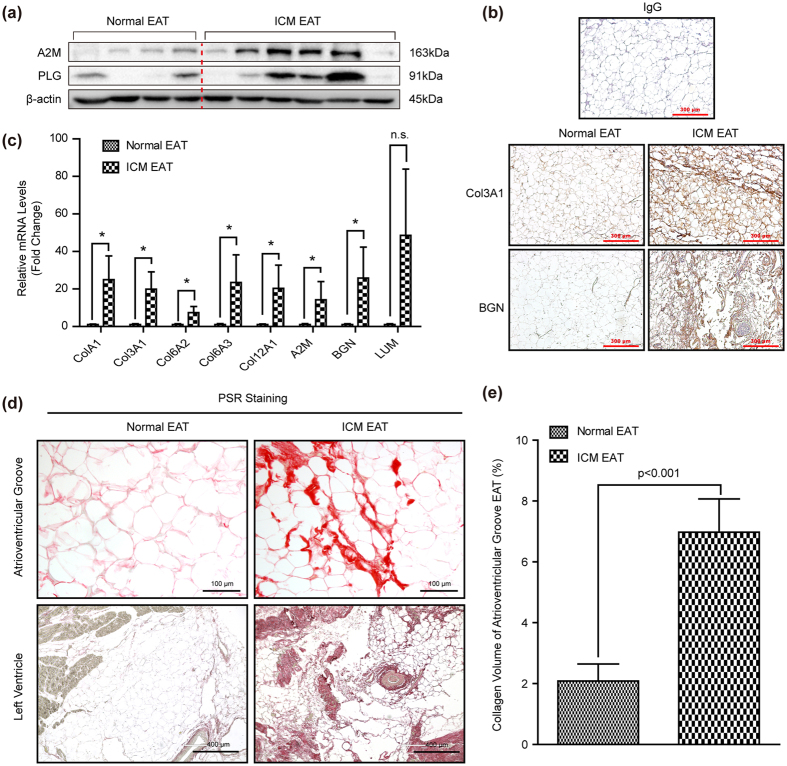
Figure 6. The ECM and its related proteins were significantly increased in the ICM EAT.
(a) The protein levels of A2M and PLG was evaluated by western blots (n = 6–8 samples). The β-actin was served as loading control; (b) The Col3A1 and BGN protein levels and cellular location was detected by immunohistochemical staining, IgG serve as a negative control. The brown represented positive staining, and blue staining indicated nucleus (n = 6–8 samples, scale bar, 300 μm); (c) The mRNA levels of Col1A1, Col3A1, Col6A2, Col6A3, Col12A1, A2M, BGN, LUM were detected by real-time PCR (n = 4–9 samples); (d) The PSR staining in the atrioventricular groove EAT and left ventricle EAT of normal donors and ICM patients, and red staining represented ECM (n = 6–8 samples, top panel scale bar, 100 μm; bottom panel scale bar, 400 μm); (e) The collagen volume quantitative result of atrioventricular groove EAT (n = 12–16 samples). *p < 0.05 v.s. normal EAT, n.s. indicated no significance.

